This project is a part of “IBM Data Science Professional Certificate on Coursera”. You can check my Jupyter Notebook on GitHub

Introduction
Los Angeles is a very vibrant city with a lot of neighborhoods, each with unique character. Some neighborhoods are quiet and cozy, has convenient store locations, while others offer a lot of fun and nightlife activities. Choosing a neighborhood to live in or open a business can be a complicated task to do, but with the help of location data from Foursquare and crime data, we can make it a little bit easier
Business Problem
The objective of this capstone project is to analyze and select the best locations in the city of Los Angeles, California to choose a neighborhood to live in or open a new business. Using data science methodology and machine learning techniques like clustering, this project aims to provide solutions to answer the business question: In the city of Los Angeles, California, what would be a better place to live in or start a business?
Target Audience
- People interested in moving to Los Angeles and looking for a perfect neighborhood for their needs
- Business owners looking to expand their business to a new location
- A beginner data scientist who may use this research as an example
Data
For this project, the following data is needed:
• List of neighborhoods in Los Angeles
• Latitude and longitude coordinates of neighborhoods to get the venue data
• Crime data in Los Angeles
• Venues Details
Data Sources
Location Data
First, we need to get a full list of all LA neighborhoods. Wikipedia article List of districts and neighborhoods in Los Angeles is a great place to start.
For geolocation data, we will use Google’s Geocoding API. To get more information about it, follow the Geocoding Developer Guide.
Venues Data (Foursquare API)
Foursquare API provides information about venues and geolocation. We will use Foursquare API to get the venue data for LA neighborhoods.
Foursquare has one of the largest databases of 105+ million places and is used by over 125,000 developers. Foursquare API will provide many categories of the venue data such as name, location, hours, rating, prices, etc.
Crime Data
To analyze criminal activity for each neighborhood we use Los Angeles Crime & Arrest Data: from Beginning 2020 to Present dataset from LA City Website. It contains information about location, time, category and other miscellaneous data from the LA Police Department.
Analysis
Location Data
Using BeautifulSoup, a Python library used for pulling data out of HTML we parse the Wikipedia page to get the list of neighborhoods and districts in Los Angeles.
Using Google’s Geocoding API, we collect the location data such as Latitudes and Longitudes of each neighborhood and store them into a pandas dataframe.

Using Folium Geospatial visualization library, we then plot these Los Angeles neighborhoods on the map.

Note: For interactive maps, please open the Jupyter Notebook in this website by pasting the notebook’s GitHub URL.
Crime Data
Now, we collect the crime data of 21 divisions of LAPD and load the data into a pandas dataframe. This data includes features like Date the case was reported, area, crime committed, etc.
Counting the number of crimes for each community Police station and plotting it as a graph, we have:

It can be seen that 77th Street division has the most number of reported cases followed by Central division. Let’s plot this information on a choropleth map using folium library. The boundary data for LAPD divisions is taken from this website

Adding the neighborhoods from previously stored neighborhoods dataframe

Venue Data
Taking the neighborhoods information from the Location data, we gather the data of venues using Foursquare API and load it into a pandas dataframe. We then classify the venues into 6 general categories:
- Shop & Service
- Outdoors & Recreation
- Travel & Transport
- Food
- Nightlife Spot
- Arts & Entertainment
Let us plot the count of each venue category

Of all the categories, “Shop & Service” venue category has many outlets i.e. popular among business owners, followed by “Food”
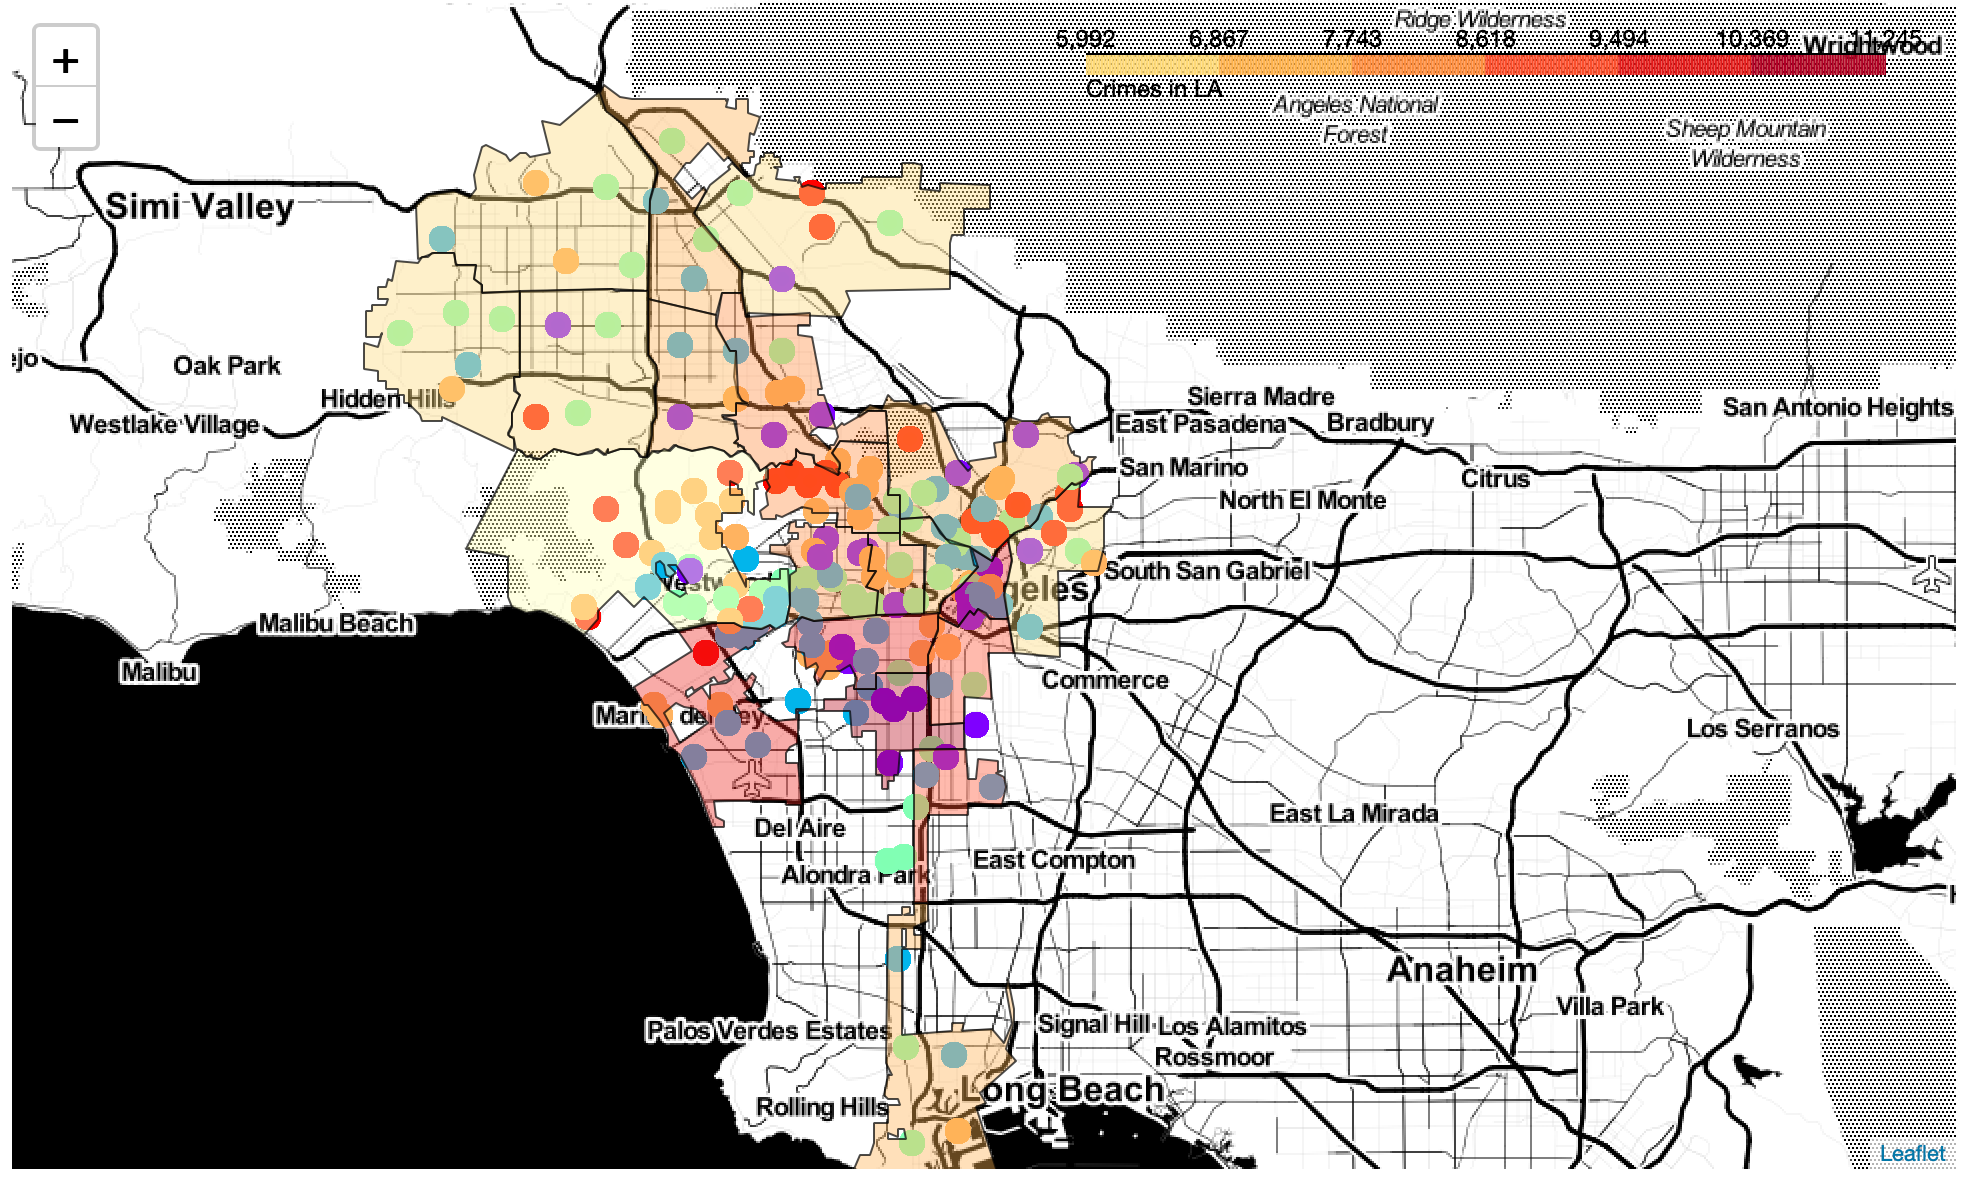
Clustering these venues into 5 clusters using k-Means algorithm and plotting them onto a map, we have

Plotting these cluster on the LAPD divisions choropleth map
Cluster Analysis
Cluster — 1

Cluster — 2

Cluster — 3

Cluster — 4

Cluster — 5
Observations
- All the venues can be grouped into 5 clusters
- Of all the clusters, Cluster 1 has least number of neighborhoods (23) and “Outdoor & Recreation” venue category is the most popular among neighborhoods in Cluster-1
- “Shop & Service” venue category is the most popular among neighborhoods in clusters 2,3 & 4
- Among all the venue categories, “Shop & Service” is the most popular category
- “Food” seems to be the second popular venue category followed by “Entertainment”
- The neighborhoods that come under Pacific, 77th Street and Southwest LAPD community divisions have higher number of crimes recorded
Conclusion
In this project, we analyzed the neighborhoods in Lon Angeles. The neighborhoods data was scraped from Wikipedia using BeautifulSoup. Then using Google’s Geocoding API and Folium maps, we plotted these neighborhoods on a map.
Next, we analyzed LAPD crime data and plotted it on a Choropleth map along with the neighborhoods to know the neighborhoods where the number of crimes is higher
Then using Foursquare API, we gathered the details of venues in the neighborhoods and divided them into 5 clusters. Finally, we plotted these on a map along with the crimes map.
Note: For interactive maps, please open the Jupyter Notebook in this website by pasting the notebook’s GitHub URL.